
Monte Carlo Process: 𝜋 approximation
Updated:
The task is to compute an approximation to 𝜋 using Monte Carlo.
Python is used for representation.
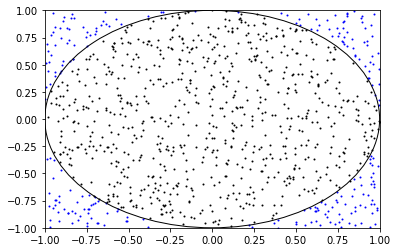
Version 1: Draw unit circle to the coordinate and plot the dots.
import numpy as np
import matplotlib.pyplot as plt
let’s setup the initial variables.
trial = 1000
inCircle = 0
And draw the unit circle to the plt.
circle = plt.Circle((0, 0), radius = 1, color='black', fill=False)
ax = plt.gca()
ax.add_artist(circle)
And then, plot the random coordinate.
for i in range(trial):
	x = np.random.uniform(-1,1)
	y = np.random.uniform(-1,1)
    if (x**2 + y**2 < 1):
        inCircle += 1
        plt.scatter(x, y, s = 1, color = "black")
    else:
        plt.scatter(x, y, s = 1, color = "blue")
Show the canvas and calculate the answer.
plt.axis([-1, 1, -1, 1])
plt.show()
ratio = inCircle/trial
π = ratio * 4 # result is here
The result comes out as:
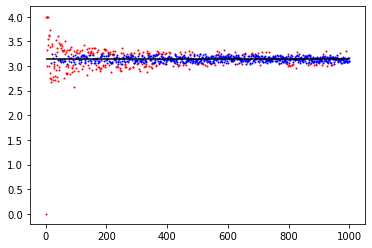
Version 2: We want to see the converging process.
Basic setup is as follows:
import numpy as np
import matplotlib.pyplot as plt
import math
Firstly, lets define function that does montecarlo processes to estimate pi.
def monteCarloPi(trial):
	cnt = 0
    for i in range(trial):
	x = np.random.uniform(-1,1)
	y = np.random.uniform(-1,1)

	if (x**2 + y**2 < 1):
		cnt = cnt+1

	return (cnt/trial)*4
And let’s define another function to plot the result. if the value is within ϵ, let’s plot the point in blue color. else, let’s do it in red.
def plotApproxProcess(x, ϵ, trial):
	plt.hlines(π, 1, trial, colors='black', linestyles='solid', label='π')
	for i in range(1, trial+1):
		result = monteCarloPi(i)
		if abs(result - x) < ϵ:
			plt.scatter(i, result, s = 1, color = "blue")
		else:
			plt.scatter(i, result, s = 1, color = "red")
And show the result.
π = math.pi
ϵ = 0.1
plotApproxProcess(π, ϵ, 1000)
plt.show()
The result comes out as:
Code in jupyter notebook is available at my github.
Leave a comment